The CO2 in the air-filled spaces (pores) between solid particles in soils consists of a mixture of CO2 from the atmosphere and CO2 produced by organisms (microbes, plants and animals) living in the soil. A simple way to envision this is to imagine a sand dune with no plants growing on it. The pores are filled with atmospheric air and thus the CO2 concentration equals the concentration of CO2 in the atmosphere. Now imagine that plants grow on the sand dune. Their roots respire and microbes decompose their dead tissues, both of which release CO2 into the pore spaces. This soil-respired CO2 mixes with the atmospheric CO2 in the pore spaces. The resulting mixture is termed soil CO2. The concentrations and carbon isotope compositions of soil CO2 are controlled by the relative contributions and the carbon isotopic compositions of the endmembers (soil-respired and atmospheric CO2, see Figure a for a graphic presentation).
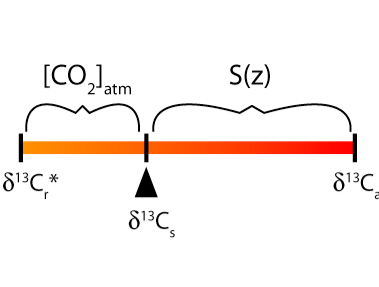 Figure a. A graphical representation of the mixing between soil-respired CO2
(δ13Cr) and atmospheric CO2 (δ13Ca)
resulting in soil CO2 (δ13Cs). The relative
contribution of CO2 from soil respiration and from atmospheric air
control the value of δ13Cs. Therefore, if the
contribution from soil respiration (S(z)) and the respired and atmospheric
δ13C values can be quantified, then atmospheric CO2
can be determined. The largest source of error using the paleosol carbonate proxy
is in estimating values of S(z). The star denotes that the effect of diffusion of
CO2 through the soil pore spaces must also be considered.
Figure a. A graphical representation of the mixing between soil-respired CO2
(δ13Cr) and atmospheric CO2 (δ13Ca)
resulting in soil CO2 (δ13Cs). The relative
contribution of CO2 from soil respiration and from atmospheric air
control the value of δ13Cs. Therefore, if the
contribution from soil respiration (S(z)) and the respired and atmospheric
δ13C values can be quantified, then atmospheric CO2
can be determined. The largest source of error using the paleosol carbonate proxy
is in estimating values of S(z). The star denotes that the effect of diffusion of
CO2 through the soil pore spaces must also be considered.
Figure displays that the stable carbon isotope composition of soil CO2 (δ13Cs) can move back and forth between the atmospheric and respired endmembers. The value of δ13Cs will be more similar to δ13Cr if the CO2 from soil respiration (S(z)) is much greater than the atmospheric CO2 concentration. All else being equal, higher atmospheric CO2 results in larger δ13Cs values (closer to δ13Ca values, i.e., δ13Cs moves to the right on the figure).
Calcium carbonate nodules formed in soils record the value of δ13Cs. Calcium carbonate nodules in paleosols (Figure b) can therefore be used to estimate past atmospheric CO2. Other required parameters include δ13Cr (determined from organic matter in fossil soils), temperature (required to calculate δ13Cs from measured δ13C values of the calcium carbonate nodules, determined using temperature proxies) and δ13Ca (determined as described above in General background and some commonalities of paleo-CO2 proxies). Values of S(z) are more uncertain and represent the largest source of error for this proxy, but they can be approximated from mean annual rainfall (for which there are other proxies), the depth of calcium carbonates below the paleosurface and the morphology of the fossil soil (based on comparison with modern soils).
The advantages of the paleosol proxy are that it does not lose sensitivity at high CO2 as much as some of the other proxies do, it can be (and has been) applied to much of the past 400 million years, and it does not rely on biological species effects that might change with the evolution of organisms. The primary disadvantage is the large uncertainty related to rather poor empirical calibrations of S(z). In addition to calcium carbonate, the iron oxide mineral goethite can be used to estimate paleo-CO2, although soils precipitating goethite tend to be richer in respired CO2, so that δ13C values of goethite are less sensitive to changes in atmospheric CO2. However, an advantage of the goethite proxy is that S(z) is related to the concentration of carbon in the goethite, which is measurable. For more information see Breecker (2013).
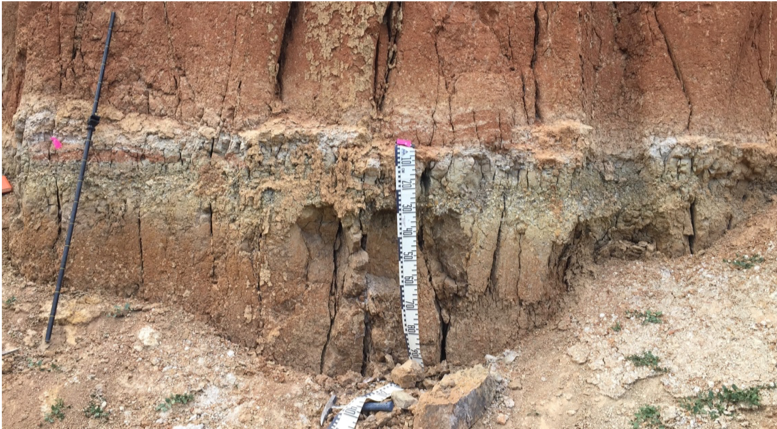 Figure b. Photograph of a 3-million-year-old paleosol (fossil soil) developed
in sedimentary rocks outcropping near Teruel, Spain. The top of the paleosol is
marked by the tape measure, which shows approximately where the land surface was
at the time this paleosol formed. This paleosol has since been buried by younger
sediments and then exhumed and exposed by erosion. The color and structure of the
paleosol change gradually with depth. There are abundant nodules of calcium carbonate
at about 30 cm giving a ‘rubbly’ appearance. Picture credit: Dan Breecker.
Figure b. Photograph of a 3-million-year-old paleosol (fossil soil) developed
in sedimentary rocks outcropping near Teruel, Spain. The top of the paleosol is
marked by the tape measure, which shows approximately where the land surface was
at the time this paleosol formed. This paleosol has since been buried by younger
sediments and then exhumed and exposed by erosion. The color and structure of the
paleosol change gradually with depth. There are abundant nodules of calcium carbonate
at about 30 cm giving a ‘rubbly’ appearance. Picture credit: Dan Breecker.
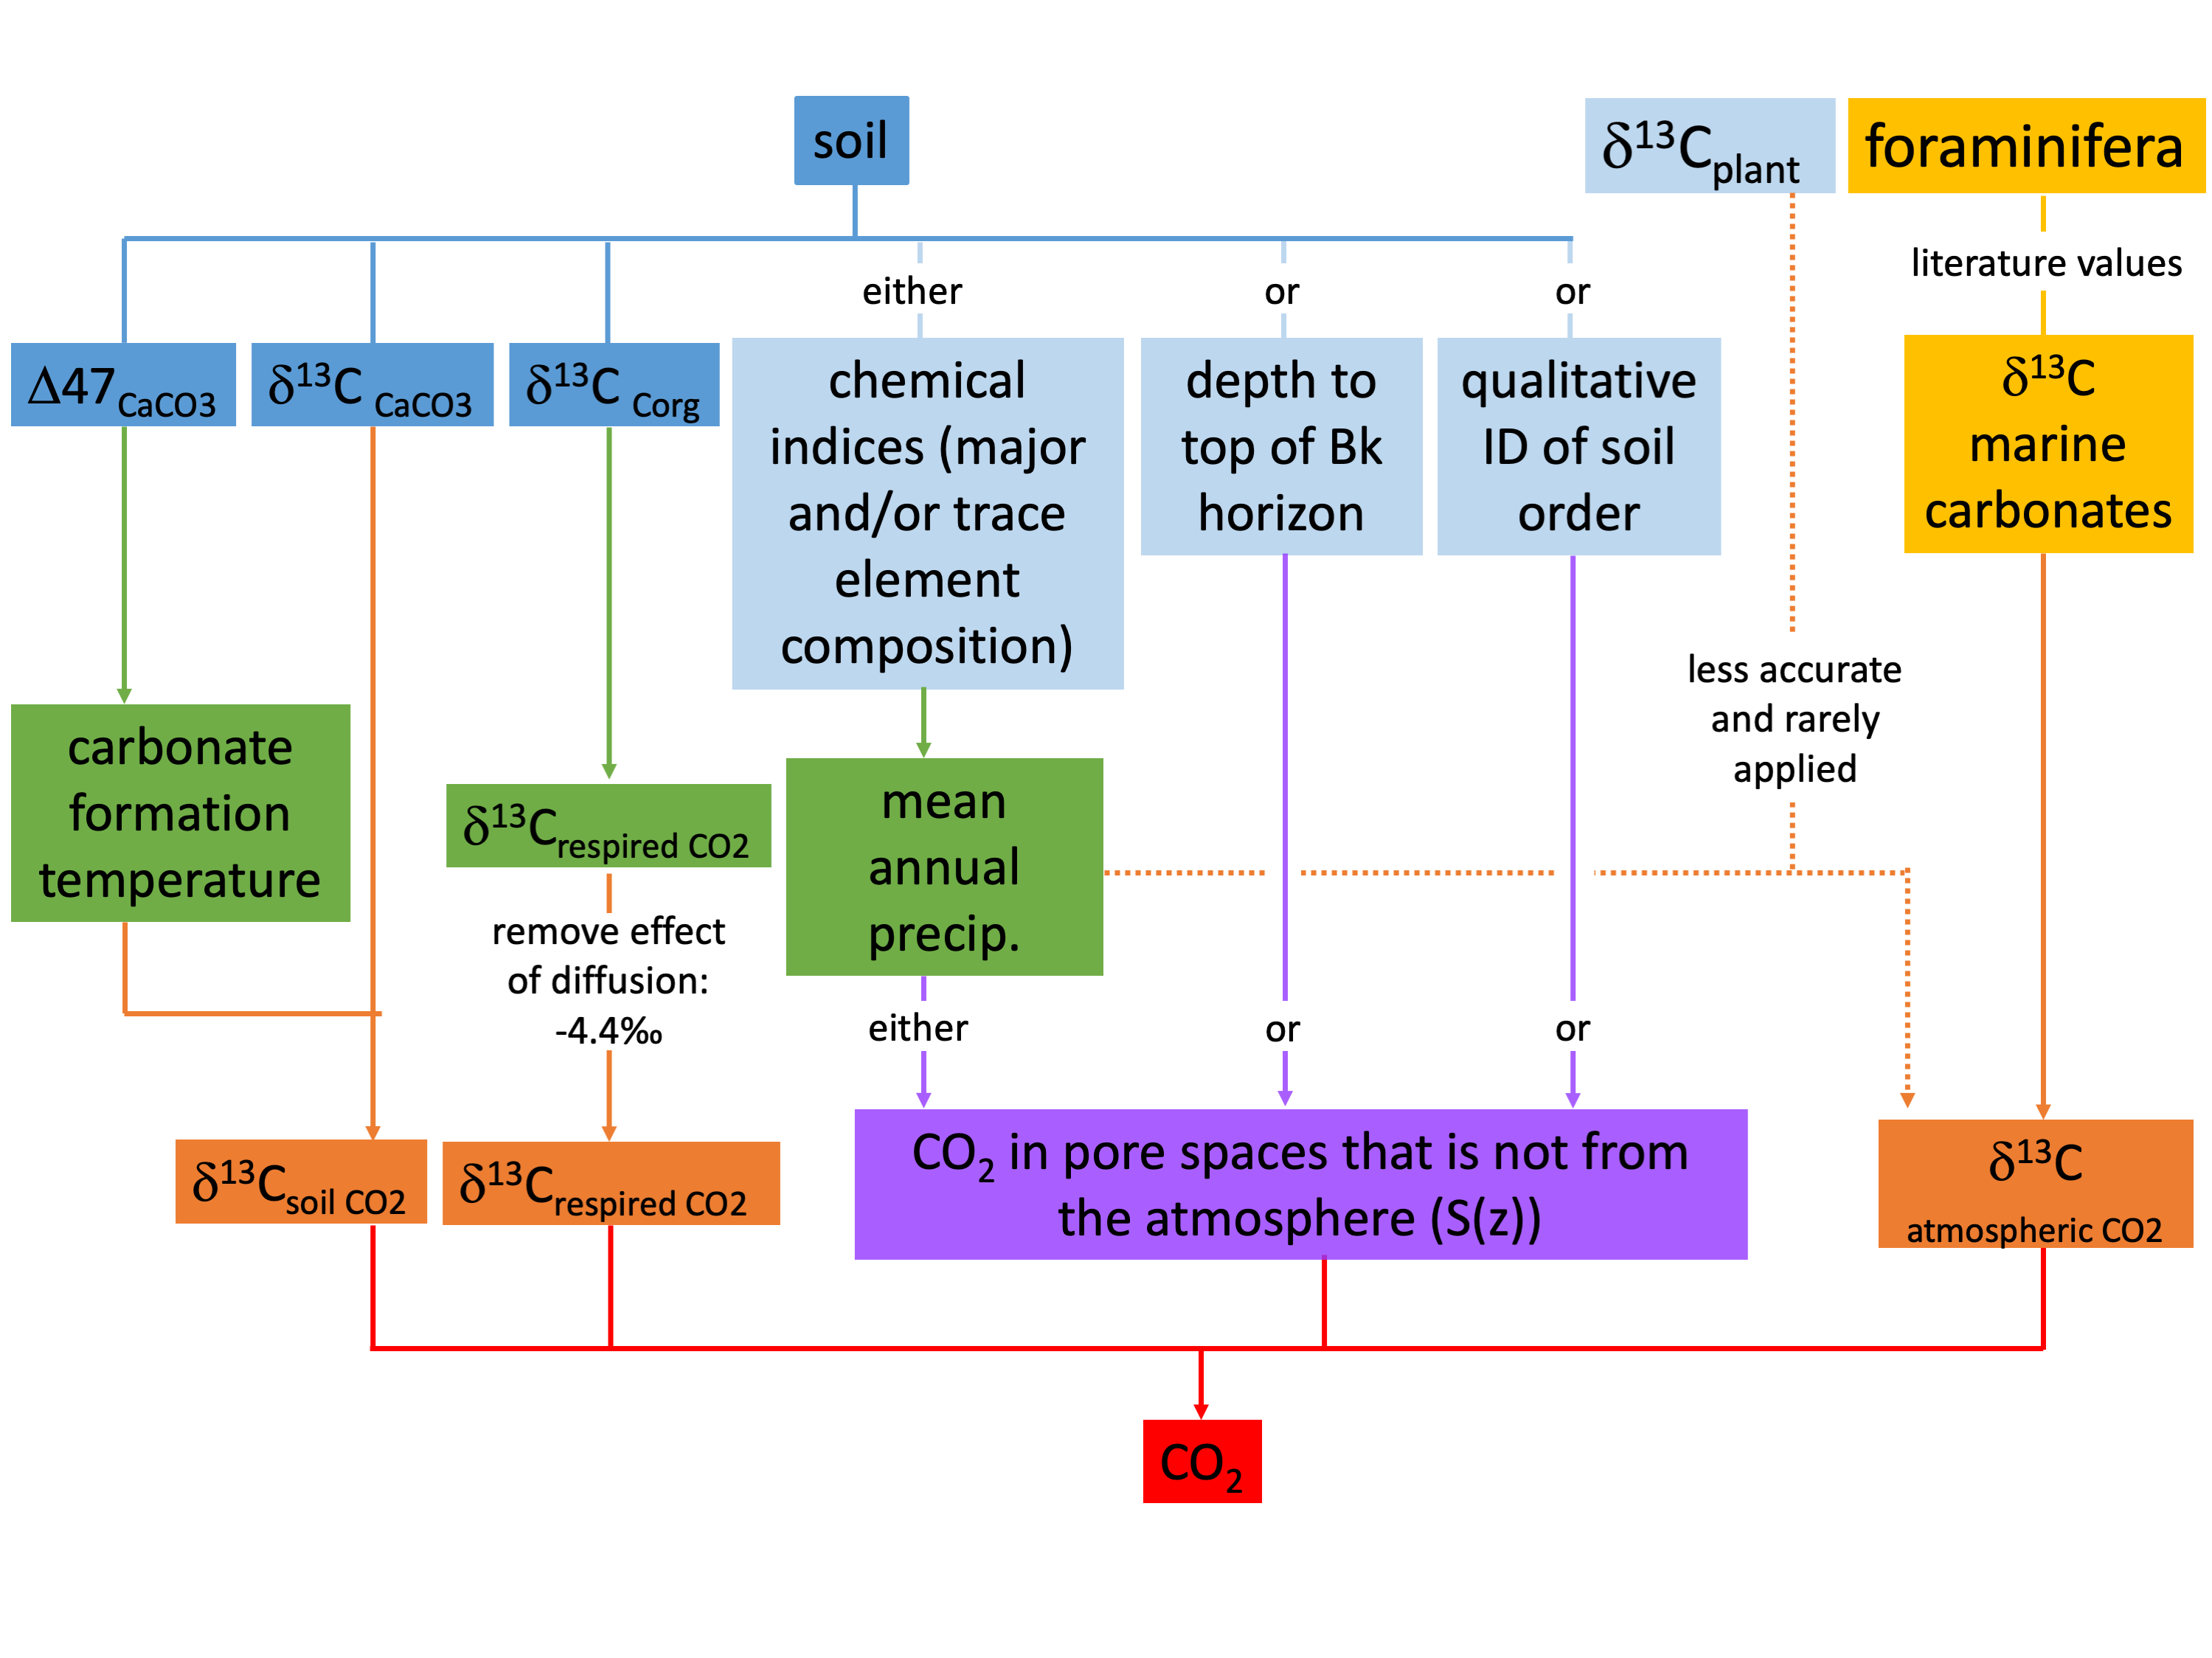 Paleosol proxy flow chart